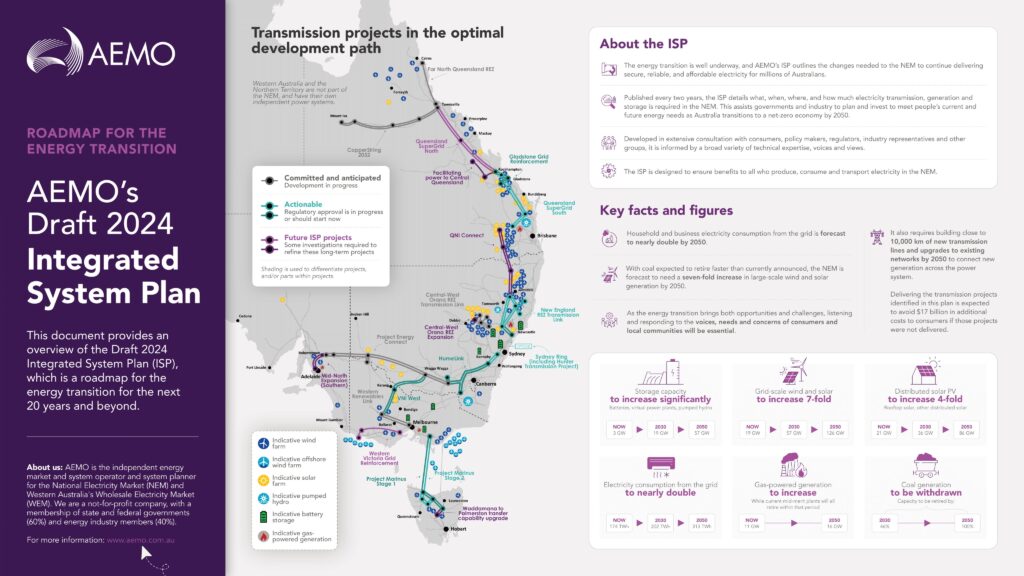
Today, the Australian Energy Market Operator (AEMO) has published the Draft 2024 Integrated System Plan (ISP). This is a roadmap for Australia’s energy transition to renewable energy over the next 20+ years.
The integrated system plan includes an optimal or best-case development path of energy generation, storage and transmission investments necessary to achieve Australia’s transition to a net-zero economy by 2050.
The plan was created after extensive collaboration over the past 18 months, with more than 1,300 stakeholders.
The plan includes a full transition away from coal-fired power generation in this country by 2050. For context, this challenge is significant, over the past 24 hours, 66% of Australia’s energy needs came from a mix of brown and black coal generation. The draft suggests that we’ll reduce that dependency on coal 46% by 2030.
In the past decade alone, 10 major coal-fired power stations have retired, starting with Munmorah in 2012 through to Liddell in 2023. As coal retires it is being replaced by low-cost renewables, connected by transmission, firmed by storage, and backed up by gas.
One of the best illustrations of what is about to happen with Australia’s energy transition is Figure 9, which shows our fuel generation mix today vs the future to 2050. Historically, our grid (like many around the world) was largely made up of coal-fired energy generation, while recent years have seen that beginning to transition. As we look into the future, the amount of energy provided by legacy sources tapers off dramatically, replaced by a lot of Wind, a lot of Solar, and a little bit of hydro and utility storage.

Australia’s energy needs will be transitioned to renewable energy in the form of wind, solar and battery storage. Storage is set to increase dramatically from around 3GW currently, to 19GW in 2030 and 57GW by 2050. Grid-scale batteries are a critical component in the plan, storing the energy for distribution when required, any time of the day.
Australia’s energy needs aren’t staying still either, with the current 174 TWh set to grow to 202 THh by 2030 and nearly double to 313 TWh compared to today, by the year 2050.
Factors that are leading to this dramatic increase on the demand side include an increase in business demand, population growth, along with a transition to electric appliances and electric vehicles.
Solar
Grid-scale wind and solar are projected to increase from 19 GW at the end of 2023, to 57 GW in 2030 and jump to 126 GW by 2050. Distributed solar (PV), predominantly made up of rooftop solar, is expected to 4x from the 21 GW available now, growing to 36 GW in 2030 and reach 86 GW by 2050.
Today, one-third of detached homes in the NEM have rooftop solar. By 2034 in the Step Change scenario, over half of the detached homes in the NEM would do so, rising to 79% in 2050, driven by ever-falling costs. At that time, the forecast total rooftop solar capacity is 72 GW.
Electric Vehicles
Electric Vehicle ownership is also expected to surge from the late 2020s, driven by falling costs, greater model choice and availability, and more charging infrastructure. By 2050, between 63% (Progressive Change) and 97% (Step Change) of all vehicles are expected to be battery EVs.
Batteries
Residential and commercial batteries are becoming more numerous as costs decline, with adoption forecast to grow strongly in the late 2020s and early 2030s. The Step Change scenario forecasts growth in capacity from today’s 1 GW to an estimated 7 GW in 2029-30, and then 34 GW in 2049-50.
You can play a part
Regarding future demand, consumers are expected to help to smooth out the demand profile by drawing on their own assets and by choosing what time of day they use electricity.
- Residential and commercial batteries can be installed to soak up surplus daytime solar for discharge later in the evening, and aggregated as virtual power plants (VPPs).
- EVs can contribute by being charged outside the morning and evening peaks, preferably through the peak solar daylight. Owners may also discharge their EV’s stored energy back to the home, or to the broader grid when needed.
- Smart home management systems may similarly control hot water systems and other appliances to take advantage of cheaper daylight electricity and avoid the more expensive peaks
- Large industrial users, including hydrogen production, may be set to take most advantage of surplus renewable generation when it is available, particularly during daylight hours.
Batteries, VPPs and EVs can reduce even more grid demand if their charging and especially discharging can be integrated with the grid. This would reduce the need for more utility-scale investment. The success of this will be largely based on the right mix of pricing to drive consumer and business behaviour.
Renewable Energy Zones
The plan includes 43 Renewable Energy Zones which are selected for the quality of their renewable resource, and their proximity to consumers and existing transmission.
By state, the needs are forecast to be:
- Tasmania: over 3.7 GW of onshore wind by 2049-50, with no offshore wind. Project Marinus and the Central Highlands REZ are established from 2029-30 onward.
- Victoria: 22 GW new utility-scale wind and solar by 2049-50 including 9 GW offshore wind. Increased network capacity from Victoria – New South Wales Interconnector West (VNI West) and Western Renewables Link (WRL) allows more wind in Western Victoria and solar in Murray River REZs. Offshore wind can access the network capacity vacated by retiring coal generation in the La Trobe Valley, and delays need for network upgrades in Gippsland areas.
- South Australia: 9 GW new utility-scale wind and solar by 2049-50. Over 9 GW of new renewables are forecasted for the region by 2050. Expansion of the Mid-North South Australia REZ is needed in the mid-2040s to access mid-north wind and northern solar.
- New South Wales: 34 GW new utility-scale wind and solar by 2049-50. Resource diversity will be opened by new networks, with an even mix of wind and solar across the state. Over 14 GW new generation capacity in Central-West Orana, 12 GW in New England, 4 GW in South West New South Wales, and 2.4 GW in Hunter-Central Coast by 2050. No offshore wind is yet forecast for New South Wales.
- Queensland. 46 GW new utility-scale wind and solar by 2049-50. The CopperString 2032 and Queensland SuperGrid upgrades allow new renewables in North Queensland (7.7 GW wind), Isaac (9 GW, mainly solar), Fitzroy (11 GW, mainly solar), Darling Downs (15 GW each of solar and wind). REZs in the south of the state are forecast to make use of existing network capacity as coal retires.
As an example of how this can, AEMO provide the following example. On 24 October 2023, 72.1% of total NEM generation came from renewable sources, a new record for a 30-minute period. Basically the system works, we just need to do a lot more of it.
One strange forecast is an increase in the use of gas, from the 11GW currently to 16GW in 2050. States like Victoria are moving away from gas in a big way, with new homes built after January 2024 no longer allowed to be connected to gas. Although cleaner than coal, gas still produces CO2 emissions, which appears to compete with the objective of being at net zero by 2050.
You can read the full 87-page plan from AEMO here.